Marketing Customer Profiling Use K-Means Clustering for Strategy Marketing
2024
In today’s competitive market, understanding consumer behavior and providing personalized offerings is essential for achieving business success. This article explores the use of two powerful techniques K-Means Clustering for customer profiling and Market Basket Analysis for product recommendations both of which can significantly enhance a company’s marketing strategy.
Customer Profiling with K-Means Clustering
Customer profiling is a critical component in crafting targeted marketing strategies. By identifying different customer segments, businesses can tailor their campaigns to meet the unique needs of each group. One of the most effective tools for customer segmentation is K-Means Clustering.
What is K-Means Clustering?
The K-means algorithm is a clustering method that requires determining the number of clusters “k” and the objects “n” to be grouped into these clusters beforehand (Mulyo & Heikal, 2022). According to Andre, Widya, and Juanda (Lubis et al., 2023) applying the K-means algorithm in data clustering is based on an iterative process to find the cluster centers, which form the fundamental basis of this algorithm.
Therefore, the researcher used the K-means algorithm in the clustering approach. It effectively analyses structured data by reducing the variance within clusters and increasing the difference between clusters, which is crucial to ensure more accurate empirical conclusions (Bui & Bahtiar, 2024).
In its application, the K-means algorithm has advantages and limitations. The advantage of the K-Means algorithm is that it is able to group large objects andcan increase the speed of the clustering process (Bui & Bahtiar, 2024). The advantage of applying the K-Mean algorithm is that the wrong initial cluster selection can produce inaccurate results (Ikotun et al., 2023). Therefore, determining the correctnumber of clusters requires a careful and planned approach.
How K-Means Clustering Helps in Customer Profiling:
Segmentation: K-Means Clustering divides customers into different segments based on features like frequency of purchase, total spending, and recency of purchase. For example, a retail company might segment customers into groups such as ‘frequent shoppers’, ‘high spenders’, or ‘occasional buyers’, each group representing distinct marketing opportunities.
Targeted Marketing: By understanding these clusters, businesses can craft specific marketing messages for each group. For example, offering discounts to ‘occasional buyers’ to encourage them to purchase more, or creating loyalty programs for ‘frequent shoppers’ to increase retention.
Improved Customer Experience: K-Means allows businesses to understand customer needs at a deeper level, enabling them to improve the customer experience by offering more personalized services and products.
How to Apply K-Means Clustering for Customer Profiling:
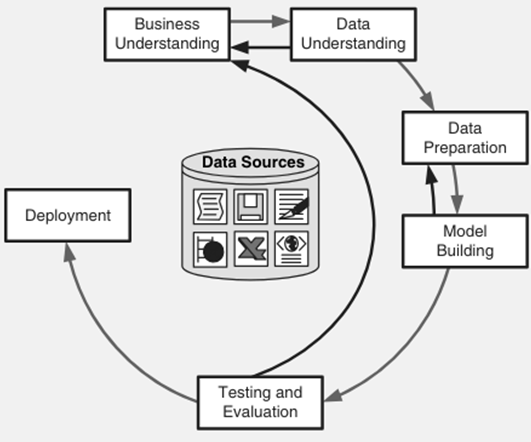
- Business Understanding: Understand the business objective, such as segmenting customers to create more targeted marketing strategies. For example, identifying customers with high purchase value but low frequency, or low purchase value but high frequency.
- Data Understanding: To apply K-Means clustering for customer profiling, collect key data such as purchase frequency, transaction value, product preferences, and demographic details like age and location. This data helps segment customers based on their behaviors and characteristics for targeted marketing.
- Data Preparation: To prepare the data for K-Means clustering, it’s important to clean it by handling missing values, either by filling them with appropriate estimates or removing incomplete entries. Additionally, normalize the data to ensure all variables, such as purchase amount and frequency of purchase, are on the same scale. This step ensures that no single variable disproportionately influences the clustering results.
- Model Building: Use K-Means to group customers into several segments. Determine the optimal number of clusters using simple methods like the Elbow Method or Silhouette Analysis. Apply K-Means to divide customers based on their behavior patterns.
- Evaluations and Profiling: Customer profiling based on Chorianopoulos & Tsiptsis (2010):
- Superstar Customers: High loyalty, high transaction volume, and high monetary value. Most valuable.
Golden Customers: High monetary value, high frequency, but average transaction size.
Typical Customers: Average in both monetary value and transaction frequency.
Occasional Customers: Low monetary value, low recency, but high transaction frequency.
Everyday Shoppers: Frequent transactions, but medium-to-low monetary value.
Dormant Customers: Low monetary value and recency, but once had high frequency.
- Deployment: Use the cluster results to design more targeted marketing strategies, such as special offers for each customer segment.
Study Case Implementation
The case is motivated by a decline in sales at SME X, indicating the need for a deeper analysis to understand customer behavior. Therefore, a customer profiling approach using K-means clustering is applied to more effectively identify customer segments. By utilizing customer transaction data, it is expected that relevant behavioral patterns can be uncovered, allowing for the development of more targeted and effective marketing strategies to boost sales at SME X.
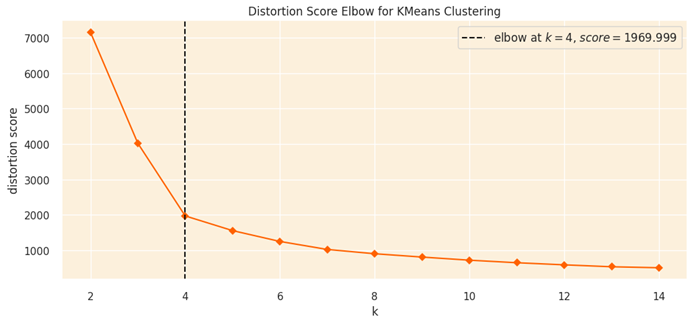
I have 4500 prepared data points with the results of K-means clustering using the Elbow Method, as shown in Figure 2. The Elbow graph shows a sharp decrease in distortion as the value of k changes from 2 to 4. At k=4, the graph reaches the “elbow” point, indicating the optimal number of clusters, with a distortion score of approximately 1969.999. After k=4, the decrease in distortion slows down, suggesting that adding more clusters does not significantly improve the model.
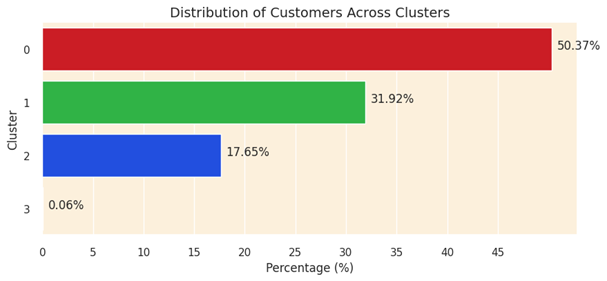
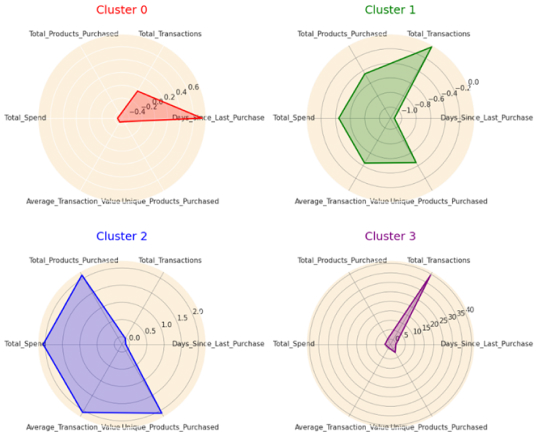
This analysis identifies four clusters, as shown in Figure 3, with the following distribution:
- Cluster 0 (Red): 50.37% of customers, the largest group.
- Cluster 1 (Green): 31.92%, the second-largest group.
- Cluster 2 (Blue): 17.65%, smaller but still important.
- Cluster 3 (Purple): 0.06%, the smallest group, possibly consisting of customers with unique characteristics.
Clusters with larger proportions (Cluster 0 and 1) may require broader marketing strategies, while smaller clusters (Cluster 2 and 3) could benefit from a more targeted approach.
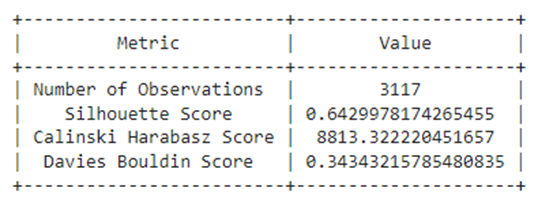
The clustering quality was evaluated using the Silhouette Score, Calinski-Harabasz Score, and Davies-Bouldin Score, which indicate good clustering quality with well-separated and cohesive clusters. This suggests that the model is reliable for customer segmentation.
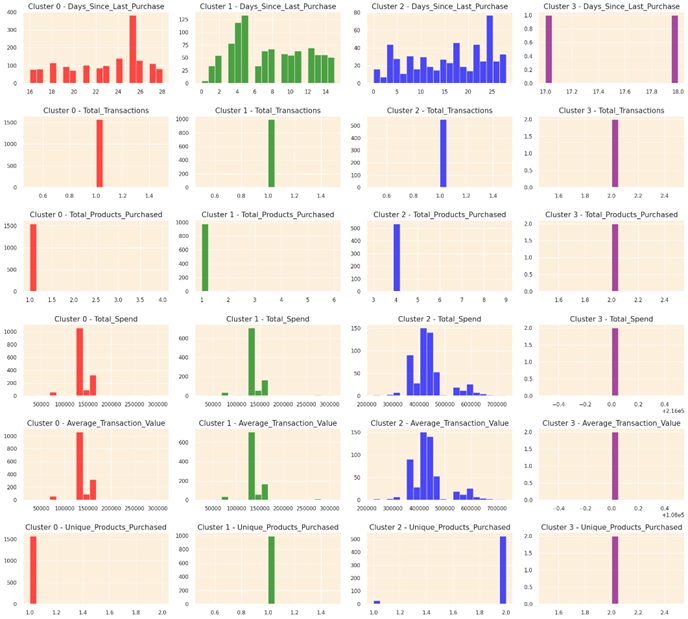
The detailed profiling results are as follows:
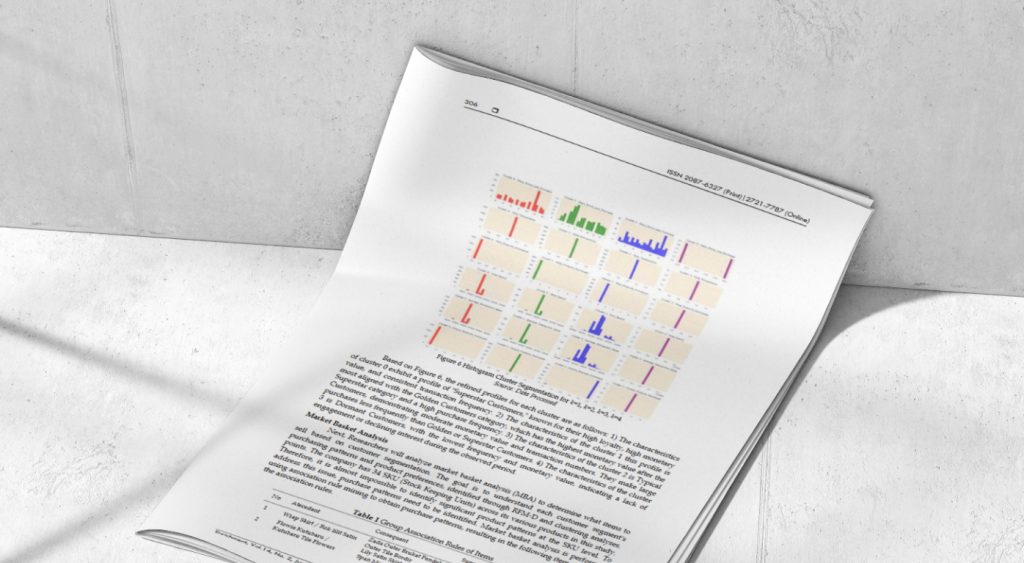
- The characteristics of cluster 0 indicate the “Superstar Customers” profile, known for high loyalty, high monetary value, and consistent transaction frequency.
- The characteristics of cluster 1 align most closely with the “Golden Customers” category, which has the highest monetary value after the Superstar category and a high purchase frequency.
- The characteristics of cluster 2 are “Typical Customers,” with moderate monetary value and transaction numbers. They make large purchases less frequently than Golden or Superstar Customers.
- The characteristics of cluster 3 are “Dormant Customers,” with the lowest frequency and monetary value, indicating a lack of engagement or declining interest during the observed period.
The benefits of customer profiling analysis using K-means clustering include:
More Effective Customer Segmentation: By identifying different customer categories such as “Superstar,” “Golden,” “Typical,” and “Dormant,” companies can group customers based on their behaviors, allowing for a more targeted approach.
More Targeted Marketing Strategies: Each cluster can be given a tailored marketing strategy. For example, “Superstar” customers may require exclusive offers or high loyalty programs, while “Dormant Customers” can be targeted with campaigns aimed at reigniting their interest.
Resource Optimization: By focusing resources and budgets on the clusters that provide the highest value, such as “Superstar” and “Golden Customers,” companies can improve spending efficiency.
Improved Customer Retention: By identifying customers showing signs of decreased interest (such as those in the “Dormant” cluster), companies can implement strategies to increase engagement and reduce churn.
Enhanced Customer Service: Profiling helps companies better understand their customers’ needs and preferences, enabling them to offer a more personalized experience and improve customer satisfaction.
Overall, this analysis helps companies design more focused strategies, improve customer management, and ultimately increase sales and loyalty.